Archives

PUR Guide 2012 Fully Updated Version

Available NOW!

This comprehensive self-study certification course is designed to teach the novice or pro everything they need to understand and succeed in every phase of the public utilities business.

Order Now

Accenture

Southern Sees the Light

How conventional utilities may drive the solar energy transition
More than 95 percent of consumers will still be connected to the centralized network for the foreseeable future. But it won’t diminish the trend toward distributed generation – and the attempts by both unconventional parties and power companies from getting into related businesses.

Vendor Neutral

(December2012) KC Electric Association expects soon to finalize installing a Sensus FlexNet network and iCon A electric meters to serve about 4,000 residential and small commercial members across a 5,000-square-mile territory in rural Colorado. Itron and C3 Energy formed an alliance to integrate and jointly market an energy management solution to North American utilities. And others...

Image: 
KC Electric Association is installing Sensus meters in rural Colorado.
PG&E became the first utility to deploy Picarro Surveyor mobile devices for gas leak detection.
Georgia Power started up the final unit at its new McDonough-Atkinson combined-cycle plant.
Siemens will supply a SGT6-5000F gas turbine for a new power plant in Manaus, Brazil.
Category: 
Vendor Neutral

The Race to Consolidate

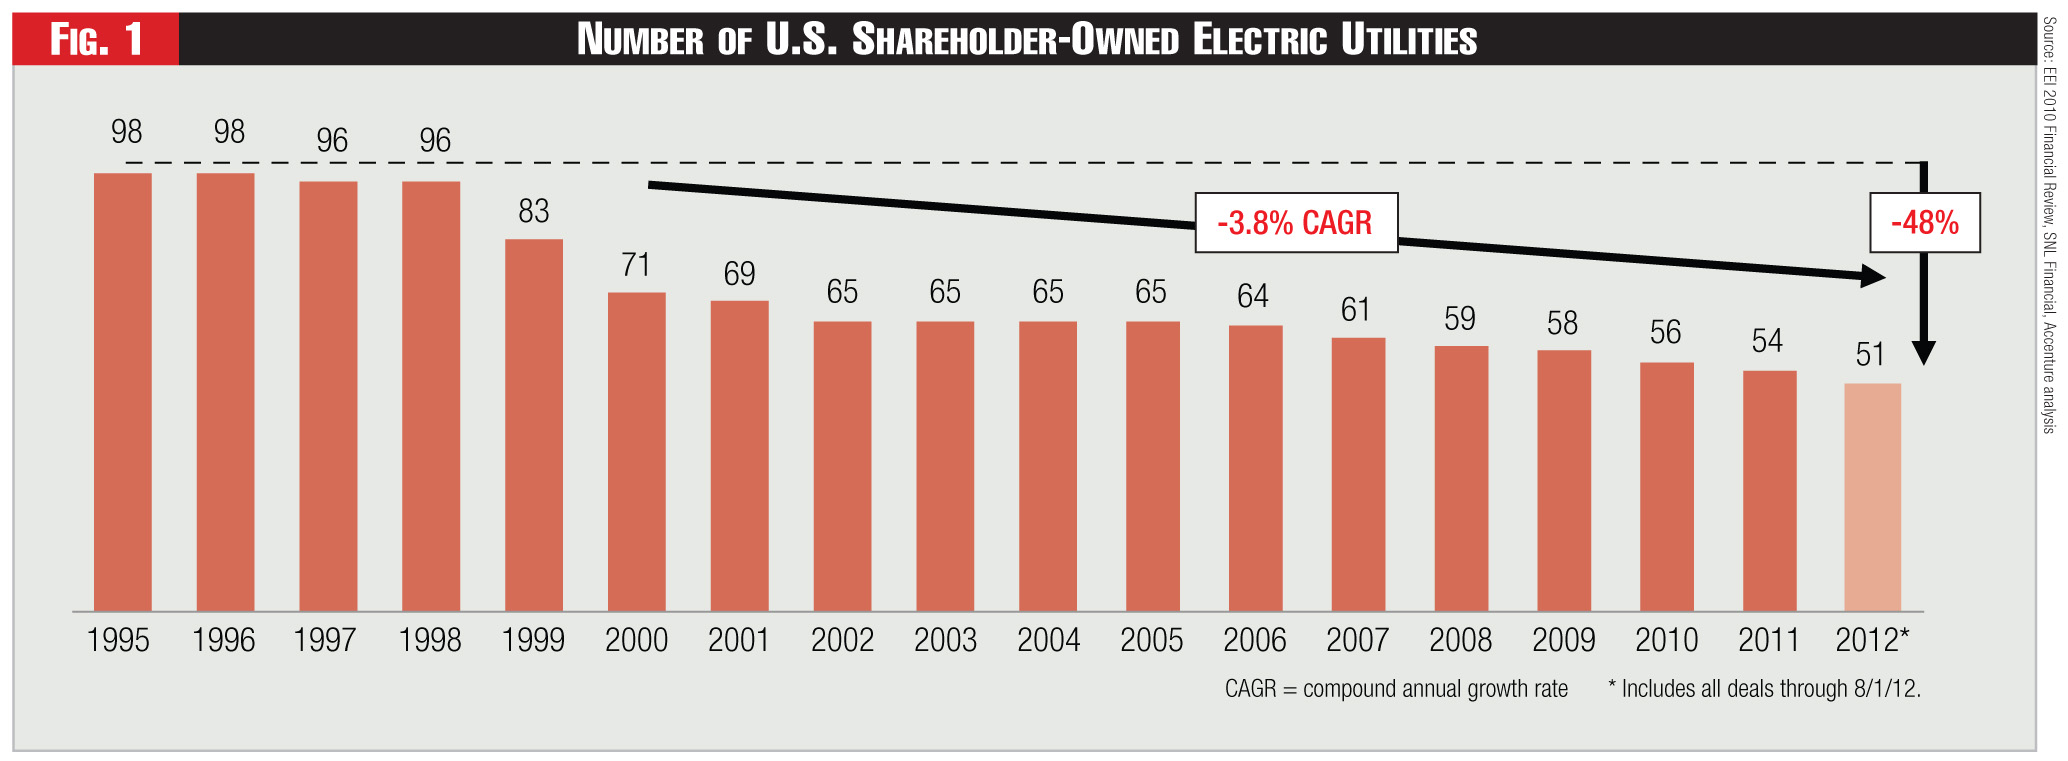
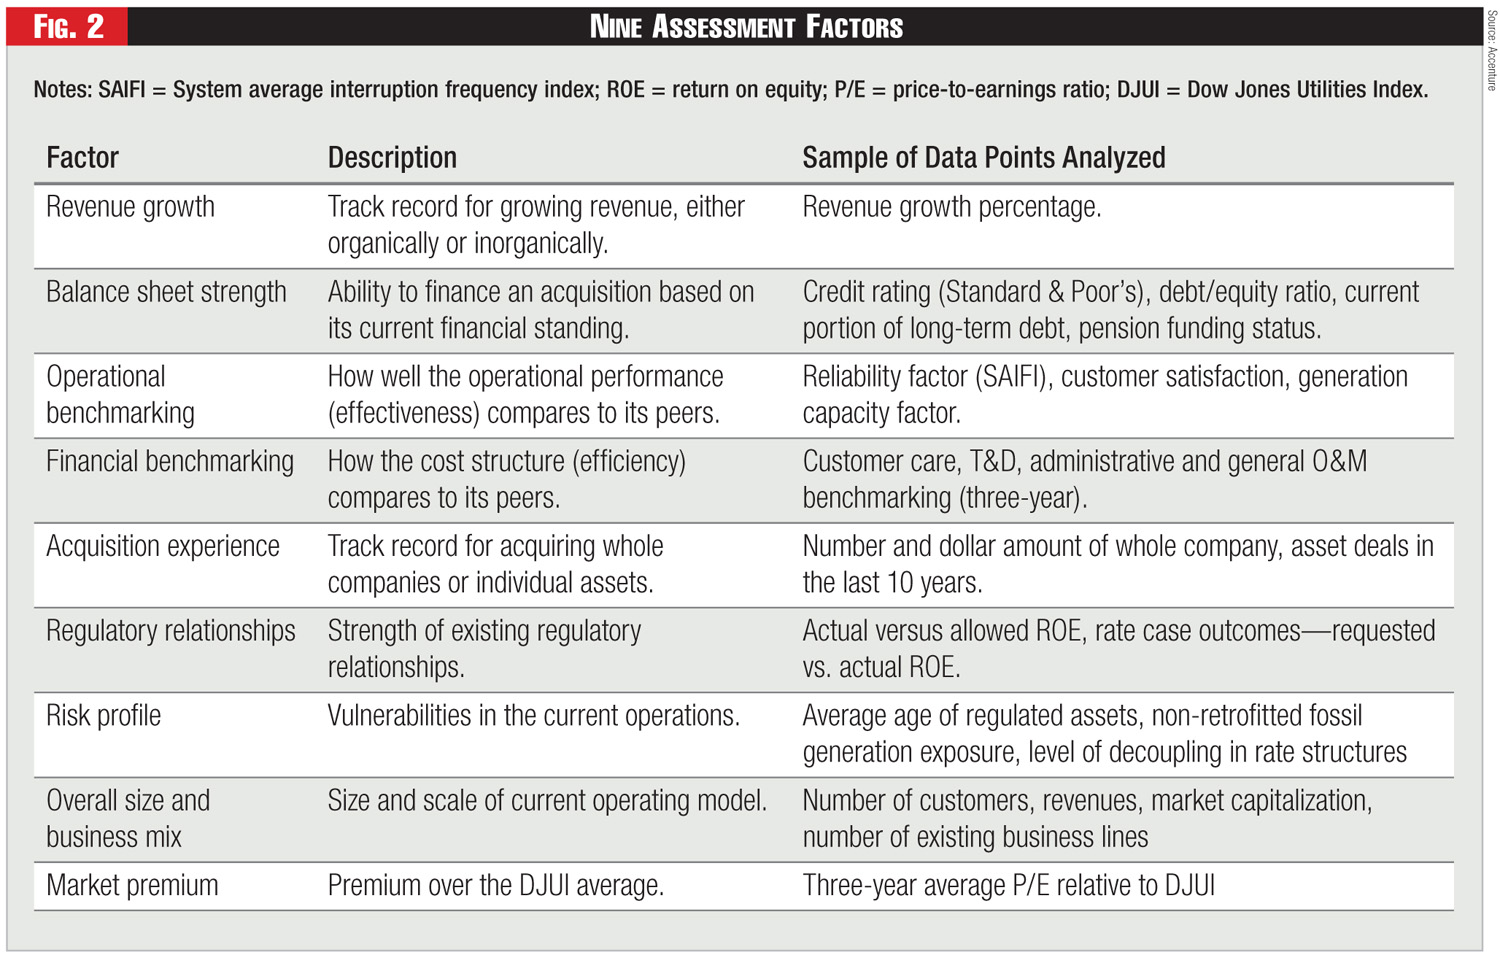
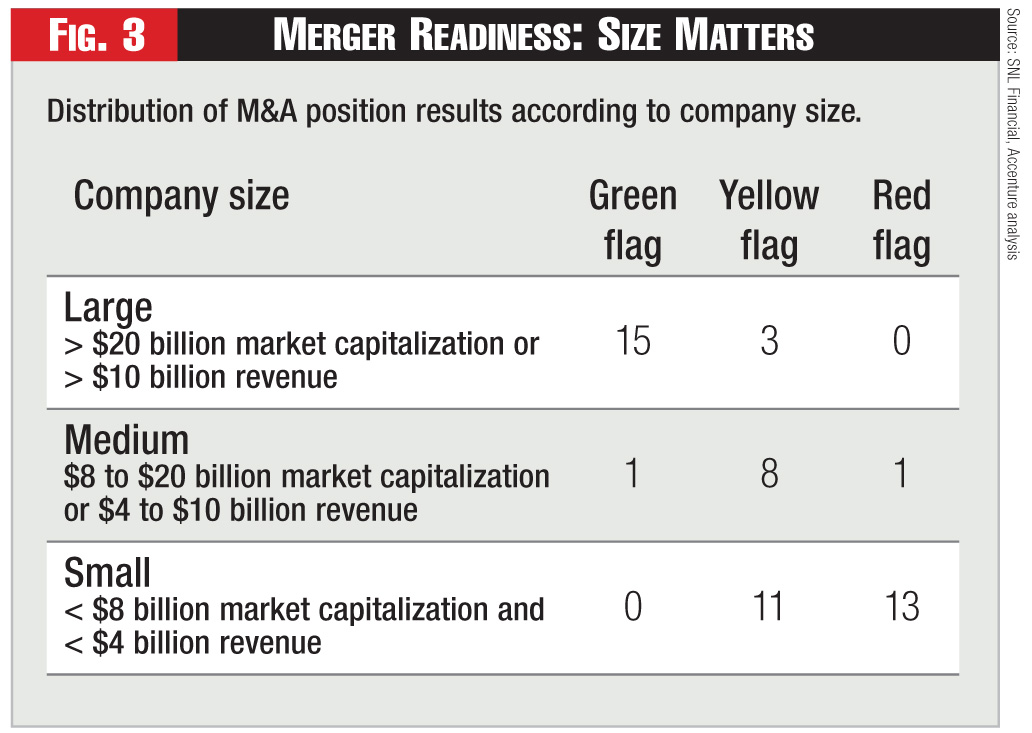
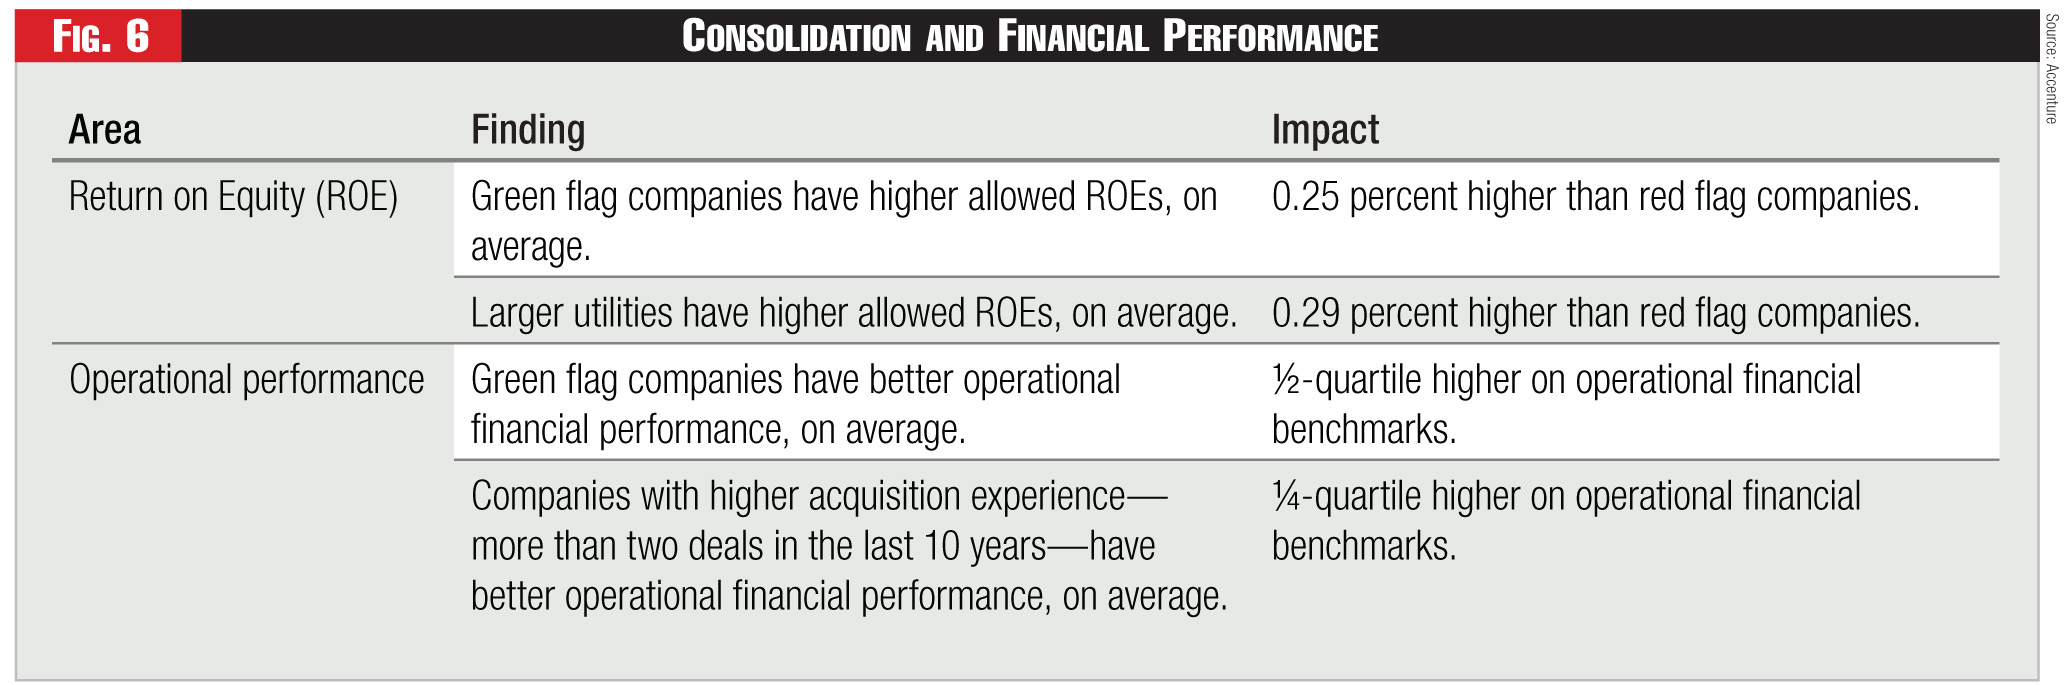
The industry’s slow-and-steady pace of mergers seems to be picking up speed, as larger and well-positioned players overtake smaller and weaker targets. Realizing the greatest value from consolidation requires companies to assess their strengths and weaknesses and focus on performance improvement—both before and after a deal gets done.

Image: 
Sidebar: 
Sidebar Title: 
Performance Improvement through M&A
Sidebar Body: 

Although analysis is subject to the imprecise nature of publicly available information, it does offer relative insight into how utilities benchmark against each other. In particular, it highlights the potential for untapped value in the utilities industry, specifically with respect to improvements in operational performance. Accenture defines untapped value as increasing the performance of all bottom-half performers to the bottom of the next performance quartile—that is, all fourth quartile performers decrease spending to the top of fourth quartile, and all third-quartile performers decrease spending to the top of the third quartile.

As seen in Figure 4, there’s significant variance of performance across the three major operations and maintenance (O&M) categories, transmission and distribution O&M per customer, customer care O&M per customer, and administration and general O&M per customer. In all cases, there’s a long tail of performance in the fourth quartile.

Taking the viewpoint that overall company performance should be improved, at least to some extent, by M&A, we find that there’s significant untapped value in the industry. Industry-wide, there’s approximately $3 billion in annual O&M untapped value, which is roughly 10 percent of the annual O&M spending for the industry. Delivering on this untapped value will be a prerequisite to driving significant shareholder value through future M&A deals.

By definition, green flag companies have a lower untapped value per customer than either yellow flag or red flag companies. This is due to the fact that operational performance—which drives untapped value—is part of the M&A strength criteria. Interestingly enough, untapped value is equally spread across industry players from size (revenue), customer count, and region perspectives. In other words, no single factor explains why some companies have higher untapped value than others. As such, the field is wide open for performance improvement.–JA, WS, and TW

Sidebar Title: 
M&A Drivers
Sidebar Body: 

Looking ahead at future whole-company transactions, several factors likely will drive the fit between future M&A partners.

• Executive Ambition: The number-one driver of M&A activity remains the C-suite’s ambition and compatibility—including factors such as personal focus, interest in M&A, and willingness to partner.

• Access to Capital: Increased ability to access more and cheaper capital is necessary to support capital project programs, which frequently are very ambitious.

• Integration Value Potential: Going beyond the more obvious rewards helps drive toward a consolidated operating model and processes.

• Pure P/E Plays: Companies with higher multiples buying companies with lower multiples can get an immediate value bump from P/E alone. This likely will happen both across categories—for example, a green flag company buying a yellow or red flag company with a lower P/E—as well as within each category.

• Regional and Portfolio Plays: Mergers can increase value by enabling access to renewables, diversifying the generation portfolio (for example, balancing environmental risk), balancing wholesale positions (long vs. short), and hedging retail and wholesale positions.

• Suitability and Strength of the Acquirer: Clarity on which company is the acquirer consistently produces greater integration benefits and returns.

• Physical Proximity: Two neighboring utilities offer greater synergies than those located many miles apart, since they can derive economies of scale by sharing local crews and other distributed functions.–JA, WS, and TW


Sidebar Title: 
Performance Improvement through M&A
Sidebar Body: 

Although analysis is subject to the imprecise nature of publicly available information, it does offer relative insight into how utilities benchmark against each other. In particular, it highlights the potential for untapped value in the utilities industry, specifically with respect to improvements in operational performance. Accenture defines untapped value as increasing the performance of all bottom-half performers to the bottom of the next performance quartile—that is, all fourth quartile performers decrease spending to the top of fourth quartile, and all third-quartile performers decrease spending to the top of the third quartile.

As seen in Figure 4, there’s significant variance of performance across the three major operations and maintenance (O&M) categories, transmission and distribution O&M per customer, customer care O&M per customer, and administration and general O&M per customer. In all cases, there’s a long tail of performance in the fourth quartile.

Taking the viewpoint that overall company performance should be improved, at least to some extent, by M&A, we find that there’s significant untapped value in the industry. Industry-wide, there’s approximately $3 billion in annual O&M untapped value, which is roughly 10 percent of the annual O&M spending for the industry. Delivering on this untapped value will be a prerequisite to driving significant shareholder value through future M&A deals.

By definition, green flag companies have a lower untapped value per customer than either yellow flag or red flag companies. This is due to the fact that operational performance—which drives untapped value—is part of the M&A strength criteria. Interestingly enough, untapped value is equally spread across industry players from size (revenue), customer count, and region perspectives. In other words, no single factor explains why some companies have higher untapped value than others. As such, the field is wide open for performance improvement.–JA, WS, and TW

Author Bio: 

Jack Azagury (jack.azagury@accenture.com) is Accenture’s North American Management Consulting lead for the resources industries, and Walt Shill (walt.shill@accenture.com) is global senior director at the company. Ted Walker (ted.h.walker@accenture.com) is a senior manager in the Accenture Utilities Strategy group. The authors acknowledge contributions from Jan Vrins, Accenture Utilities Management Consulting group, and Jason Allen, Accenture Research.

Positioning to win in the contest for scale.

The Fortnightly 40 Best Energy Companies

(September 2012) Our annual financial ranking shows some remarkable shifts among the industry’s shareholder value leaders. Despite flat demand and low commodity prices, investor-owned utilities are investing heavily in capital assets. Investment discipline and operational excellence distinguish leaders on the path to financial performance.
Category: 
The <i>Fortnightly 40</i> Best Energy Companies
Sidebar: 
Sidebar Title: 
Behind the Rankings
Sidebar Body: 

Our annual survey of power and gas company performance relies on a modified DuPont model, based on its 89 year-old namesake approach for calculating shareholder value in asset-intensive industries. In 2008 we tweaked the model—which originally was developed in 1919 by a finance executive at E.I. du Pont de Nemours & Co.—to measure growth on a long-term, sustainable basis (See sidebar “F40 Model Characteristics”).

The Fortnightly 40 model combines several common measures of financial performance—profitability, dividend yield, cash flow, return on equity (ROE) and return on assets (ROA)—together with a sustainable growth-rate calculation, to produce an overall picture of a company’s value and long-term prospects. To avoid the pitfalls of short-term fluctuations, the model evaluates four years of results for each company. (This represents a change from 2008 and previous F40 rankings, which considered three years of financial results.)

The universe for the ranking—which this year numbers 82 companies—includes publicly traded, U.S.-based companies with major assets in energy production, transportation and retail delivery, and positive shareholder equity value for the past four years. Pure-play mining and exploration & production companies are excluded, but a few pure-play merchant power generation companies are included in the sample.–MTB

Credits: The Fortnightly 40 model was developed in 2006 by former Fortnightly Executive Editor Richard Stavros and Jean Reaves Rollins, managing partner of the C Three Group in Atlanta.

F40 Model Characteristics

Time Frame: 4-year average


Sample: 80 largest U.S.-based investor-owned power and gas companies, with assets in power generation or electricity and gas transmission and distribution.

Components:

1. Profitability= Margin = Income from Continuing Operations/Total Revenues.

2. Dividend Yield= Annual Declared Dividends/Year-End Stock Price.

3. Free Cash Flow= Operating Cash Flow from Continuing Operations – Capital Expenditures.

4. DuPont ROE Five-Ratio Model:

a. Earnings after taxes (EAT) = Income from Continuing Operations after Taxes;

b. Earnings before taxes (EBT) = Income from Continuing Operations + Income Taxes;

c. Earnings before interest and taxes = Income from Continuing Operations before Income Taxes and Interest;

d. Revenues = Total Revenues;

e. Assets = Total Assets; and

f. Equity = Total Common Shareholders Equity.

5. DuPont ROE= (EAT/EBT)×(EBT/EBIT)×(EBIT/Revenues)×(Revenues/Assets)×(Assets/Equity).

6. DuPont ROA= (EAT/Revenue)×(Revenue/Assets)

7. Sustainable Growth= DuPont ROE×(1–Dividend Payout Ratio).

8. Fortnightly Index9. Companies excluded from the FY2011 survey due to M&A activity: Allegheny Energy, DPL, and Nicor.

Author Bio: 

Michael T. Burr is Fortnightly’s editor-in-chief. He acknowledges the editorial contributions of the C Three Group and Accenture.

A challenging year brings a change in the rankings.

Customer-Care Tipping Point

Channel strategies for the new energy consumer
Self-service is the key to reducing operational costs and providing customers with the interactive and mobile tools they want -- and increasingly that they expect.

Going Once ...

Asset options in a fast-moving market.
Mergers and acquisitions can help companies balance their asset portfolios and improve their financial strength. But economic and regulatory forces are driving more buyers into the market, and the demand for attractive targets might soon outstrip the supply.

Cheap Gas Forever?

Demand Curve Points to Rising Prices
Even with recent large natural gas discoveries and strong inventories, the supply of natural gas isn’t elastic enough to handle significant demand increases. Rising gas prices will push coal back into the money despite coal plants’ high costs to comply with EPA regulations.