Charting the DSM Sales Slump

Demand-side management (DSM) has become increasingly important for utilities across the country. In an effort to address environmental concerns and rising energy costs, utilities are deploying DSM to reduce the amount of energy consumed over the course of the year and/or during peak periods.1 These programs are not new to the utility industry, having been around since the 1970s. DSM programs and technologies encourage customers through the use of incentives to buy more energy efficient technologies and to shift demand from peak hours (where the power grid is stressed due to high demand) to off-peak hours.
But DSM, by lowering sales growth, has made it difficult for utilities to recover their fixed costs, since a large portion of these costs are recovered through volumetric charges expressed in cents per kWh sold. In order to set new rates for an upcoming period of time, utilities file rate cases with state utility commissions. Rates are set so that the utility will make an allowed profit on sales above their projected costs over the period. Sales must be projected in order to set rates to meet the utility’s revenue requirement.2
 In recent years, many utilities across the industry have consistently over-forecasted sales due to factors like DSM and codes and standards that are difficult to account for in sales forecasting models. Forces such as these are putting downward pressures on sales. There are also certain intangible factors, such as a relative decline in consumer sentiment, that influence utility sales but simply cannot be captured in a quantitative model.3
Currently, one of the greatest problems in utility sales forecasting is determining how much, if any, DSM is accounted for in the historical data used to estimate sales forecasting models. In instances where utilities employ DSM programs whose impacts are not fully captured in their sales models, certain techniques can be used to account for their impacts. By not accounting fully for the amount of DSM captured in sales models, utilities would otherwise overestimate electric sales for a given period of time. For this reason, the majority of utilities with DSM programs make adjustments to sales forecasts to account for DSM program impacts not captured by their sales models.
In order to determine the methods utilities are currently employing to deal with DSM, The Brattle Group reached out to 15 utilities to ask if they made any exogenous adjustments to their load forecasts for DSM. These North American utilities were medium-to-large sized utilities and had significant regional variation, spanning the Mid Atlantic, Midwest, Northeast, Southeast, and Western parts of the United States and parts of Canada. The survey told us that there are five main methods used to deal with DSM in sales forecasting, which, for the sake of convenience, we can characterize as follows: 1) Already Reflected – No Adjustment Needed; 2) No Prior History – Forward Only; 3) Prior DSM History – Embedded + Incremental; 4) Reconstructed Data – As If No DSM; 5) Econometric estimation of DSM impacts.
In the discussion that follows, we provide explanations of these four methods, plus graphic illustrations. We also provide a sample of responses (all anonymous) that we received from our survey participants.
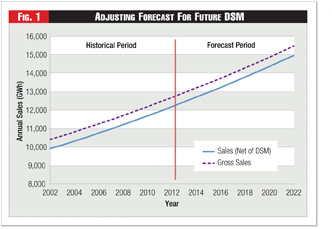
 Method 1 – It’s Already in the Data: The first method is to forecast sales without adjusting for DSM at all. The theory behind this is that DSM impacts are already fully accounted for in the historical data used to estimate sales models. The adjustment is not warranted either because there is no history of DSM and no expected amount of DSM in the future or the level of DSM has stayed constant in the past and is expected to stay constant in the future (as shown in Figure 1).
Method 2 – Going Forward Only: In contrast to the first method described above, each of the three remaining methods attempts to make adjustments to the rate case sales forecast to account for DSM impacts.
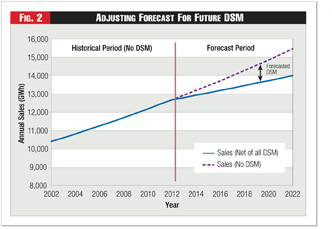
 The most common method of these last three methods used to adjust sales for DSM impacts entails subtracting incremental DSM savings that are not embedded in historical sales from forecasted sales. In the simplest scenario, a utility with projected DSM programs would have no history of DSM. In this instance, as shown in Figure 2, the utility could simply subtract all future impacts from sales forecasts. The future impacts would be estimated based on engineering assessments, analysis of program results from other utilities or some combination of the two.
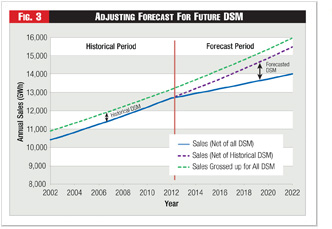
 Method 3 – Embedded + Incremental: For utilities with a history of DSM programs, estimating incremental DSM is much more difficult. In order to do this, the utility must first estimate how much DSM is already accounted for in its sales data, which presents its own problems and uncertainty. This amount of “embedded” DSM is carried forward in the forecast.
Next, the utility must estimate future DSM impacts. The incremental DSM is therefore the difference between projected DSM and embedded DSM. Once the sales model projects sales for a given year, the incremental DSM impacts above the historical, embedded impacts are subtracted from projected sales. Figure 3 illustrates this adjustment. This is the most commonly used method.
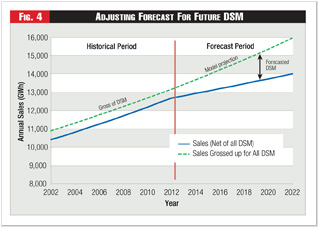
 Method 4 – As If No DSM: The last of the four methods, and the second most common approach to making an actual adjustment to DSM, is one where companies add back in the exogenously estimated historical DSM impacts to historical sales to come up with what sales would have been had DSM not occurred.
This method is illustrated in Figure 4. The green dotted line in the historical period is sales gross of DSM. These econometric sales forecasting models are effectively estimated over a reconstructed data series. These models predict a future devoid of DSM. To forecast sales net of DSM, these companies simply subtract the full value of projected DSM impacts from their model forecasts of gross sales.
In all four methods, historical and projected DSM program impacts must be measured. A variety of methods can be used to estimate DSM program impacts; some utilities rely on an engineering-based analysis, some rely on statistical measurement and verification studies to estimate DSM impacts, and others rely on expert judgment. Regardless of exactly how DSM impacts are estimated, a separate adjustment outside the sales forecasting model is used to measure these impacts.
Method 5 – Activity Variable: In this method, which is often empirically difficult to apply because of data limitations, utilities insert some measure of DSM programmatic activity as an explanatory variable in their sales forecasting model. The activity measure could be DSM expenditures, number of participating customers or a similar variable. If the variable yields a statistically significant and economically meaningful coefficient, it can then be used to forecast the future impact of DSM in sales.
Validating the Survey Results
In order to validate the results of our survey, we compared our results to a survey done by Hydro One Networks (“Hydro One”) in April 2011.4
Hydro One had surveyed one hundred organizations in North America and a total of 41 organizations responded, including both Canadian and U.S. utilities. This survey had found that the most common approach to adjusting for DSM was the exogenous adjustment approach of subtracting incremental DSM savings from future impacts. The second most common approach was one where historical DSM program savings were added back in to actual historical sales and an econometric model was then estimated over this reconstituted data. The full impacts from future DSM programs were then subtracted from the gross sales forecasts in order to get a projection of electric sales that are net of DSM impacts.
Of the 41 respondents to the Hydro One survey, 75 percent of respondents had accounted for DSM using an implicit methodology, 20 percent had accounted for DSM using an explicit methodology such as the gross-up methodology, and five percent of respondents had not reflected DSM in their load forecasts.
The results of the surveys appear quite consistent.
They each point to the fact that most utilities account for DSM impacts in their sales forecasts. Of those that account for DSM, the vast majority make exogenous adjustments to their sales forecasts to account for DSM program impacts. In addition, some other utilities employ the other approaches previously mentioned in order to estimate the impact of DSM programs on utility electric retail sales.
ABOUT THE AUTHORS: Ahmad Faruqui (ahmad.faruqui@brattle.com) and Eric Schulz are economists with The Brattle Group based in San Francisco.
Endnotes:
1. For a current discussion on how DSM is deployed in the United States and abroad, please consult the 23 essays in Energy Efficiency: Towards the End of Demand Growth, Fereidoon P. Sioshansi (editor), Academic Press, 2013.
2. See, for example, the application of Xcel Energy in Minnesota where the company is requesting a rate increase partly to recover fixed costs that otherwise would not be recovered because sales growth has slowed down due to its DSM programs. Especially relevant to this paper are Faruqui’s rebuttal and direct testimonies which can be found at: http://www.xcelenergy.com/staticfiles/xe/Regulatory/Regulatory%20PDFs/MN-Rate-Case-2013/Vol-1-7-of-11-Faruqui-Economic-Energy-Eff-Impacts-Sales-Forecasts-Rebuttal.pdf and http://www.xcelenergy.com/staticfiles/xe/Regulatory/Regulatory%20PDFs/MN-Rate-Case-2013/vol-2A-6.pdf.
3. For a discussion of these factors, please see the paper by Ahmad Faruqui and Eric Shultz entitled, “Demand Growth and the New Normal,” Public Utilities Fortnightly, December 2012.
4. Hydro One Networks, “Business Load Forecast Methodology: Attachment 1, Appendix D,” 2013/2014 Transmission Revenue Requirement & Rate Application to the Ontario Energy Board, (Docket No. EB-2012-0031, Exhibit A-15-02), filed May 28, 2012 (accessed March 5, 2013).


