Benchmarking PM Practices

As part of an annual electric T&D benchmarking program, First Quartile Consulting (1QC) has surveyed project management practices for several years. In addition, 1QC has conducted consulting projects to help several utilities improve their project management processes. The 2012 1QC benchmarking survey and results from previous years provide insights into the project manager’s (PM) role (including role in construction), staffing benchmarks, outcome measures, and software tools.
PM Role and Results
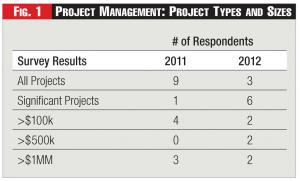
Most large utilities with significant T&D capital budgets have implemented some form of project management organization. One of the differences among utilities is which projects get assigned a PM. Last year about half the companies assigned a PM to all capital projects (although the process might be simplified for small jobs); this year companies are more likely to have established various cost or complexity thresholds. Utilities continue to find the right trade-off between PM overheads and the resulting benefits of better-managed projects. (See Figure 1.)
PMs generally work in a matrix organization, and their authority can be described as limited, strong, or balanced. In a strong matrix the PM has more ability to control the functional resources assigned to the project, including more direct day-to-day control. Companies are more likely to report PM authority as “balanced” or “limited” now than in the past – which isn’t surprising given the functional orientation of most utilities. (See Figure 2.)
PM Staffing Benchmarks
Staffing ratios reported in the survey over the last few years have remained fairly constant. The average annual budget managed per PM is $28 million, with a median value of $19 million (vs. $25 million and $16 million in 2011), although there’s a fairly significant range between companies and between project managers, depending on the mix of projects and other factors. Support staff (cost and schedule analysts) has been roughly equal to the number of PMs, although the number is influenced by the complexity of the supporting project management scheduling and cost software.

Outcome Measures
The argument for formal project management is that it achieves better outcomes than informal processes. We have no definitive answer to prove or disprove this argument, although most utilities act as if they believe it’s true. The traditional outcome measures for projects are on-time, on-budget, and to-specifications. Unfortunately, the measures are hard to benchmark.
• Time: Most survey respondents report that more than 80 percent of projects are completed on the scheduled date – but there’s no agreement on when to freeze the due date.
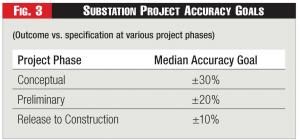
• Cost: Similarly most companies create cost estimates at various stages in the process: 1) conceptual; 2) after preliminary engineering; and 3) after final design and release to construction. We’ve surveyed companies on accuracy goals at each project phase and received relatively consistent results, as shown in Figure 3. We’re still somewhat surprised, however, when we ask for actual performance against goals by phase; most utilities don’t measure performance against the estimate at each phase.
• Spec: Measuring the “to-specification” performance is also difficult to benchmark; a likely metric would be number of change orders, but the discipline in managing change orders varies greatly among utilities.

One portfolio measure that has emerged from survey and consulting work is “Percent jobs walked-in” – a measure of whether companies do what they say they’re going to do. One analogy is a trip to the grocery store. Say you give your son $20 dollars to go to the store and buy bread and milk, and he returns with soda and chips and $1 change. Using a portfolio measure, he was within 5 percent of budget – but in fact 100 percent of the activity was “walked in” during the last minute. Although “Walked in” is an extremely important measure of outcomes, it’s difficult to benchmark; survey respondents say walk-ins account for 20 percent of jobs, but they have different starting points for finalizing the budget.
Construction Role
The construction role appears to be one of the most important, but problematic issues among our utilities. Most utilities recognize the importance of having the PM involved very early in the planning process for large capital projects, but have difficulty engaging the construction folks earlier. Constructability and operability reviews are becoming more common, but the relationship between construction and engineering is often strained. The PM is seen as a key bridge between the groups – and companies are trying to find organizational solutions to involve construction, where most of the costs are incurred. Simply getting good status information is a challenge for most utilities who do not have well-developed construction management functions. When contractors are involved in design and engineering, the problems are exacerbated.
Software Choices
As it was previously, MS-Project was the primary PM scheduling software in this year’s survey, although Primavera was a close second. Almost all the companies rely on other systems that are cobbled together to consolidate cost, budgets, labor-hours, and construction status into useful reports. Even more challenging for most utilities is the ability to adequately forecast workload and resource demands. A schedule can’t be successful without capacity planning (e.g., resources and outage constraints) to develop a reasonable schedule – and the software hasn’t proven up to the challenge for most utilities. (See Figure 4.)
Tracking Practices
Although project management practices at utilities have remained fairly stable over the last several years, it’s important to track changes over time. Further, identifying best practices can help utilities adapt to their changing workloads and project demands.

ABOUT THE AUTHOR: Tim Szybalski (tim.szybalski@1qconsulting.com) is a director at First Quartile Consulting (http://1stquartileconsulting.com), a management consulting firm that also performs annual benchmarking studies across electric T&D and customer service for North American utilities. Szbalski’s career includes more than 15 years as an engineer and manager for SDG&E and PG&E.


